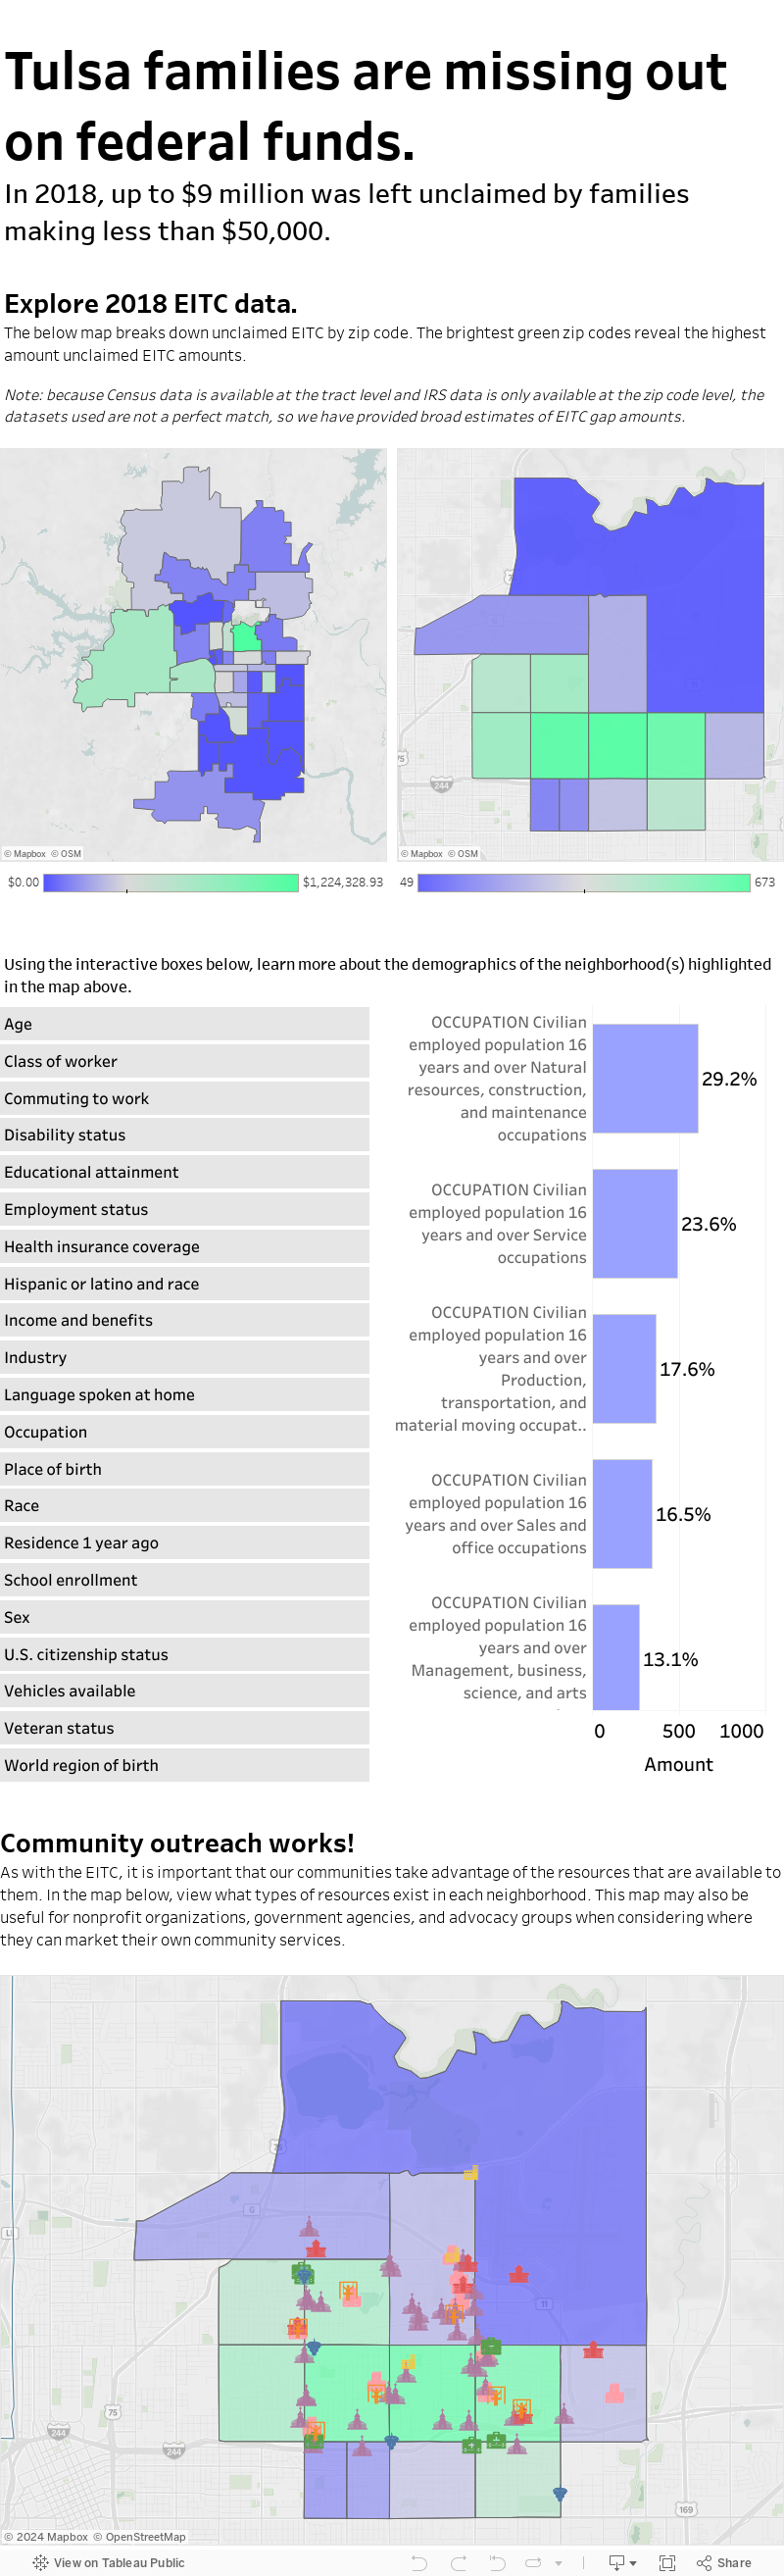
What amount and where are Earned Income Tax Credit gaps in Tulsa in 2018?
-
Sources
private
Source: We All Count
IRS data only goes down the zip code level.
-
Helping families file their taxes for the first time. Helping families receive funds to keep them out of poverty cycles
Determine where families who qualify for EITC are not filing for EITC.
Yes
Low to moderate income families
-
-
-
IRS Zip Code Data - Oklahoma, DPO3 - Selected Economic Characteristics
-
IRS, Census
What amount of earned income tax credits were left on the table in 2018?, Where are the zip codes that could use help the most?, Where in the zip code are the people who need help?, What are the demographics of the people in these tracts?, Where can I market our solutions? What was our impact by zip code?
Comparing families making under $50,000 who filed IRS EITC amounts by zip code to the Census total number of families making under $50,000.
-
Descriptive
No
The IRS data only disaggregated data on income and zip code. We used many census variables to help disaggregate the data in other ways.
Predicitive
NA
NA
NA
NA
Casual
-
NA
Content
-
The data brings in two data sources to help answer the research question
NA
Relevance was focused on the non-profit client.
Anyone who can read in English at a 10th grade level can read and understand the map.
This was written for the nonprofit client.
Overview of the data for a quick analysis.
Informative
Access
Public
The information is presented with community resource & demographic data.
This information will change each year based on tax filings and populations making under a certain amount.
Tableau branding
Interactive Dashboard
Dynamic
Digital
Medium
Feedback was given via email and verbal conversations.
There was only one type of report provided
9b
Overview of the data for a quick analysis.
The link for the Tableau map will be available until Tableau, or 9b takes it down.
No specific training needed.
Data is owned by the IRS and the Census; Tableau map is owned by 9b.
None
Digital